Develop yourself from Data Analyst to Data Scientist (incl. guidance)
duration: 156 hours |
Language: English (US) |
access duration: 365 days |

Details
Do you have affinity with data? And do you already have experience working with data and analyzing data and do you want to take your knowledge and skills to the next level? Would you like to develop yourself from Data Analyst to Data Scientist? Then this learning path is for you!
When you choose this learning path, you get:
- access to courses, livelabs and exams on the roles of Data Analyst, Data Wrangler, Data Ops and Data Scientist. In addition, you get access to many more training courses, practice exams, bootcamps, e-books and so on.
- guidance from our Learning & Development team, together with you we set goals, create a schedule and monitor your progress.
Data Analyst
You'll get started with the skills and knowledge you need as a Data Analyst. You will learn how to collect and monitor data and then process it into information. This information is then analyzed and turned into knowledge. To do this, you will learn how to use Python and Microsoft R to analyze data. In addition to these languages, you will also learn about Hadoop and MongoDB and get to work with Data Silos.
Data Wrangler
Next, you'll explore the role of Data Wrangler. Topics such as wrangling with Python, MongoDB and building data pipelines are covered.
Data Ops
After that, you'll be ready to gain the knowledge and skills as a Data Ops. You'll learn how to operationalize and scale data, taking into account compliance and governance. You will explore topics such as governance, security, harnessing volume and velocity.
Data Scientist
Finally, you'll prepare yourself to become a junior Data Scientist so you can make smart business decisions based on data. Skills and knowledge about the use of data visualization, APIs, Machine Learning and Deep Learning algorithms are covered.
Result
After completing this learning path, you will have sufficient tools to make smart business decisions as a Data Scientist. You will have acquired solid knowledge and skills regarding analyzing, wrangling, operationalizing and visualizing data.
Prerequisites
- Familiarity with Python and R programming
- Comfortable working with data with applications such as Excel
- Basic math and statistics skills
- Familiarity with cloud systems, such as Azure and AWS
Target audience
Business Analyst, Data analist
Content
Develop yourself from Data Analyst to Data Scientist (incl. guidance)
Data Architecture Primer
Data Engineering Fundamentals
Data engineering is the area of data science that focuses on practical applications of data collection and analysis. In this course, you will explore distributed systems, batch vs. in-memory processing, NoSQL uses, and the various tools available for data management/big data and the ETL process.
Python for Data Science: Introduction to NumPy for Multi-dimentional Data
Python for Data Science: Advanced Operations with NumPy Arrays
Python for Data Science: Introduction to Pandas
Python for Data Science: Manipulating and Analyzing Data in Pandas DataFrames
R for Data Science: Data Structures
R for Data Science: Importing and Exporting Data
R for Data Science: Data Exploration
R for Data Science: Regression Methods
Discover how to apply regression
R for Data Science: Classification & Clustering
Data Science Statistics: Simple Descriptive Statistics
Explore the two most basic types of descriptive statistics, measures of central tendency and dispersion. Examine the most common measures of each type, as well as their strengths and weaknesses.
Data Science Statistics: Common Approaches to Sampling Data
The goal of all modeling is generalizing as well as possible from a sample to the population as a whole. Explore the first step in this process, obtaining a representative sample from which meaningful generalizable insights can be obtained.
Data Science Statistics: Inferential Statistics
Inferential statistics go beyond merely describing a dataset and seek to posit and prove or disprove the existence of relationships within the data. Explore hypothesis testing, which finds wide applications in data science.
Accessing Data with Spark: An Introduction to Spark
Getting Started with Hadoop: Fundamentals & MapReduce
Apache Hadoop is a collection of open-source software utilities that facilitates solving data science problems. In this course, you will explore the theory behind big data analysis using Hadoop and how MapReduce enables the parallel processing of large datasets distributed on a cluster of machines.
Getting Started with Hadoop: Developing a Basic MapReduce Application
Getting Started with Hadoop: Developing a Basic MapReduce Application
Hadoop HDFS: Introduction
HDFS is the file system which enables the parallel processing of big data in distributed cluster. Explore the concepts of analyzing large datasets and explore how Hadoop and HDFS make this process very efficient.
Hadoop HDFS: Introduction to the Shell
Discover how to set up a Hadoop Cluster on the cloud and explore the bundled web apps - the YARN Cluster Manager app and the HDFS NameNode UI. Then use the hadoop fs and hdfs dfs shells to browse the Hadoop file system.
Hadoop HDFS: Working with Files
Explore the Hadoop file system using the HDFS dfs shell and perform basic file and directory-level operations. Transfer files between a local file system and HDFS and explore ways to create and delete files on HDFS.
Hadoop HDFS: File Permissions
HDFS is the file system which enables the parallel processing of big data in distributed cluster. When managing a data warehouse, not all users should be given free reign over all the datasets. Explore how file permissions can be viewed and configured in HDFS. The NameNode UI is used to monitor and explore HDFS.
Data Silos, Lakes, & Streams: Introduction
Traditional data warehousing is transitioning to be more
- cloud-based and this can be a key area that must be mastered for
- data science. In this course you will examine the organizational
- implications of data silos and explore how data lakes can help make
- data secure, discoverable, and queryable. Discover how data lakes
- can work with batch and streaming data.
Data Silos, Lakes, and Streams: Data Lakes on AWS
Traditional data warehousing is transitioning to be more
- cloud-based and this can be a key area that must be mastered for
- data science. In this course, you will discover how to build a data
- lake on the AWS cloud by storing data in S3 buckets and indexing
- this data using AWS Glue. Explore how to run crawlers to
- automatically crawl data in S3 to generate metadata tables in
- Glue.
Data Silos, Lakes, & Streams: Sources, Visualizations, & ETL Operations
Traditional data warehousing is transitioning to be more
- cloud-based and this can be a key area that must be mastered for
- data science. In this course, you will discover how to configure
- Glue crawlers to work with different data stores on AWS. Examine
- how to visualize the data stored in the data lake with AWS
- QuickSight and how to perform ETL operations on the data using Glue
- scripts.
Data Analysis Application
Discover how to perform data analysis using Anaconda Python, R, and related analytical libraries and tools.
Analyzing Data with Python
Practice performing data analysis tasks using Python by
- configuring VSCode, loading data from SQLite into Pandas, grouping
- data and using box plots. Then, test your skills by answering
- assessment questions after using Python to calculate frequency
- distribution, measures of center, and coefficient of
- dispersion.
Final Exam: Data Analyst
Final Exam: Data Analyst will test your knowledge and application of the topics presented throughout the Data Analyst track of the Skillsoft Aspire Data Analyst to Data Scientist Journey.
Data Wrangling with Pandas: Working with Series & DataFrames
Discover how to perform data transformations, data cleaning, and statistical aggregations using Pandas DataFrames.
Data Wrangling with Pandas: Visualizations and Time-Series Data
Visualize and explore data in Pandas using popular chart types like the bar graph, histogram, pie chart, and box plot. Discover how to work with time series and string data in datasets.
Data Wrangling with Pandas: Advanced Features
Discover how to perform advanced grouping, aggregations, and filtering operations on DataFrames. Working with masks and indexes, cleaning duplicated data, and assigning columns as categorical to perform operations is also covered.
Data Wrangler 4: Cleaning Data in R
Explore the essential methods for wrangling data with R.
Data Tools: Technology Landscape & Tools for Data Management
Explore the technology landscape and the tools used to implement data management. Discover how to use machine learning in data analytics and the capabilities of machine learning implementation in the cloud.
Data Tools: Machine Learning & Deep Learning in the Cloud
Explore machine learning solutions provided by AWS and Microsoft. Compare the prominent tools and frameworks that can be used to implement machine learning and deep learning.
Trifacta for Data Wrangling: Wrangling Data
Discover the essential methods for wrangling data with Trifacta.
MongoDB for Data Wrangling: Querying
To carry out data wrangling tasks you need to gather, filter, modify, and query data. Perform MongoDB actions related to data wrangling using Python with the PyMongo library.
MongoDB for Data Wrangling: Aggregation
To carry out data wrangling tasks you need to reshape, aggregate, and summarize data. Perform MongoDB actions related to data wrangling through the PyMongo library.
Getting Started with Hive: Introduction
Apache Hive is one of the most
Getting Started with Hive: Loading and Querying Data
Hive simplifies working with large
Getting Started with Hive: Viewing and Querying Complex Data
Apache Hive is one of the most popular data warehouses out in
- the market used for data science. It simplifies working with large
- datasets in files by representing them as tables. This allows them
- to be queried with a simple and intuitive query language. In this
- course you will explore how to create, load, and query Hive
- tables.
Getting Started with Hive: Optimizing Query Executions
Hive allows analysis of big data by
Getting Started with Hive: Optimizing Query Executions with Partitioning
In this course, you will explore the ways query executions can be optimized, including the powerful technique of partitioning datasets.
Getting Started with Hive: Bucketing & Window Functions
Explore how Hive query executions
Getting Started with Hadoop: Filtering Data Using MapReduce
Apache Hadoop is a collection of open-source software utilities that facilitates solving data science problems. Extracting only the meaningful information from a dataset can be painstaking, especially if it is very large. In this course, you will examine how Hadoop's MapReduce can be used to speed up this operation.
Getting Started with Hadoop: MapReduce Applications With Combiners
Apache Hadoop is a collection of open-source software utilities
- that facilitates solving data science problems. Hadoop enables
- speedy analysis of large datasets by distributing them on a cluster
- and processing them in parallel. Explore the use of Combiners to
- make MapReduce applications more efficient by minimizing data
- transfers.
Getting Started with Hadoop: Advanced Operations Using MapReduce
Apache Hadoop is a collection of open-source software utilities that facilitates solving data science problems. In this course, explore how MapReduce can be used to extract the five most expensive vehicles in a dataset and then how to build an inverted index for the words appearing in a set of text files.
Accessing Data with Spark: Data Analysis Using the Spark DataFrame API
Apache Spark is an open-source cluster-computing framework used for data science and it has become the defacto big data framework. In this course, you will explore how to analyze real datasets using the DataFrame API methods. Discover how to optimize operations using shared variables and combine data from multiple DataFrames using joins.
Accessing Data with Spark: Data Analysis using Spark SQL
Data Lake: Framework & Design Implementation
Discover how to design and implement data lakes in the cloud and on-premises using standard reference architectures and patterns that can help identify the proper data architecture.
Data Lake: Architectures & Data Management Principles
Discover how to implement data lakes for real-time data management. Explore data ingestion, data processing, and data life-cycle management using AWS and other open-source ecosystem products.
Data Architecture - Deep Dive: Design & Implementation
Explore various types of data architecture and implementation of strategies using NoSQL, CAP theorem, and partitioning to improve performance.
Data Architecture - Deep Dive: Microservices & Serverless Computing
Explore various types of data architecture and implementation of strategies using NoSQL, CAP theorem, and partitioning to improve performance.
Data Wrangling with Python
Perform data wrangling tasks including using a Pandas DataFrame to convert multiple Excel sheets to separate JSON documents, extract a table from an HTML file, use mean substitution and convert dates within a DataFrame. Then, test your skills by answering assessment questions after using a Pandas DataFrame to convert a CSV document to a JSON document, replace missing values with a default value, split a column with a delimiter and combine two columns by concatenating text.
Final Exam: Data Wrangler
Final Exam: Data Wrangler will test your knowledge and application of the topics presented throughout the Data Wrangler track of the Skillsoft Aspire Data Analyst to Data Scientist Journey.
Deploying Data Tools: Data Science Tools
Discover the different uses of data
Delivering Dashboards: Management Patterns
Explore the concept of dashboards and the best practices that can be adopted to build effective dashboards. How to implement dashboards and visualizations using PowerBI and ELK and the concepts of leaderboard and scorecards is also covered.
Delivering Dashboards: Exploration & Analytics
Explore the role played by dashboards in data exploration and deep analytics. Examine the essential patterns of dashboard design and how to implement appropriate dashboards using Kibana, Tableau, and Qlikview.
Cloud Data Architecture: DevOps & Containerization
Discover how to implement cloud architecture for large scale applications, serverless computing, adequate storage, and analytical platforms using DevOps tools and cloud resources.
Compliance Issues and Strategies: Data Compliance
It's crucial that organizations remain compliant with their big data implementations. Examine compliance and its relationship with big data, as well as popular resources for developing compliance strategies
Implementing Governance Strategies
As organizations become more data science aware, it's critical to understand the role of governance in big data implementation. In this course you will examine governance and its relationship with big data, and how to plan and design a big data governance strategy.
Data Access & Governance Policies: Data Access Oversight and IAM
Data sensitivity and security breaches are common in news media reports. Explore how a structured data access governance framework results in reducing the likelihood of data security breaches.
Data Access & Governance Policies: Data Classification, Encryption, and Monitoring
Before data can be sufficiently protected, its sensitivity must be known. Explore how data classification determines which security measure applies to varying classes of data.
Streaming Data Architectures: An Introduction to Streaming Data
Spark is an analytics engine built
Streaming Data Architectures: Processing Streaming Data
Discover how to develop applications
Scalable Data Architectures: Introduction
Explore a theoretical foundation on the need for and the characteristics of scalable data architectures. Using data warehouses to store, process, and analyze big data is also covered.
Scalable Data Architectures: Introduction to Amazon Redshift
Using a hands-on lab approach, explore how to use Amazon Redshift to set up and configure a data warehouse on the cloud. Discover how to interact with the Redshift service using both the console and the AWS CLI.
Scalable Data Architectures: Working with Amazon Redshift & QuickSight
Explore the loading of data from an external source such as Amazon S3 into a Redshift cluster, as well as the configuration of snapshots and the resizing of clusters. Discover how to use Amazon QuickSight to visualize data.
Building Data Pipelines
Explore data pipelines and methods of processing them with and without ETL. Creating data pipelines using Apache Airflow is also covered.
Data Pipeline: Process Implementation Using Tableau & AWS
Explore the concept of data pipelines, the processes and stages involved in building them, and the technologies like Tableau and AWS that can be used.
Data Pipeline: Using Frameworks for Advanced Data Management
Discover how to implement data pipelines using Python Luigi, integrate Spark, and Tableau to manage data pipelines, use Dask arrays, and build data pipeline visualization with Python.
Data Sources: Integration
To become proficient in data science, you have to understand
- edge computing. This is where data is processed near the source or
- at the edge of the network while in a typical cloud environment,
- data processing happens in a centralized data storage location. In
- this course you will exam the architecture of IoT solutions and the
- essential approaches of integrating data sources.
Data Sources: Implementing Edge on the Cloud
To become proficient in data science, you have to understand
- edge computing. This is where data is processed near the source or
- at the edge of the network while in a typical cloud environment,
- data processing happens in a centralized data storage location. In
- this course you will explore the implementation of IoT on prominent
- cloud platforms like AWS and GCP. Discover how to work with IoT
- Device Simulator and generate data streams using MQTT.
Data Ops 16: Securing Big Data Streams
Examine the security risks related to modern data capture and processing methods such as streaming analytics, the techniques and tools employed to mitigate security risks, and best practices related to securing big data.
Harnessing Data Volume & Velocity: Big Data to Smart Data
Explore the concept of smart data and the associated life cycle and benefits afforded by smart data. Frameworks and algorithms that can help transition big data to smart data are also covered.
Data Rollbacks: Transaction Rollbacks & Their Impact
Explore the concepts of transactions, transaction management policies, and rollbacks. Discover how to implement transaction management and rollbacks using SQL Server.
Data Rollbacks: Transaction Management & Rollbacks in NoSQL
Explore the differences between transaction management using NoSQL and MongoDB. Discover how to implement of change data capture in databases and NoSQL.
Implementing Data Ops with Python
Perform data ops tasks with Python including working with row subsets, creating new columns with Regex, performing joins and spreading rows. Then, test your skills by answering assessment questions after working with field subsets and computed columns, and performing set operations and binding rows.
Final Exam: Data Ops
Final Exam: Data Ops will test your knowledge and application of the topics presented throughout the Data Ops track of the Skillsoft Aspire Data Analyst to Data Scientist Journey.
Balancing the Four Vs of Data: The Four Vs of Data
The four Vs of big data are a popular paradigm used to extract the meaning and value from massive datasets. Discover the four Vs, their purpose and uses, and how to extract value using the four Vs.
Data Science 2: Data Driven Organizations
In order for an organization to be data science aware, it must evolve and become data driven. In this course, you will examine the meaning of a data driven organization and explore analytic maturity, data quality, missing data, duplicate data, truncated data, and data provenance.
Raw Data to Insights: Data Ingestion & Statistical Analysis
To master data science it is important to take raw data and turn that into insights. In this course you will explore the concept of statistical analysis and implement data ingestion using various technologies including NiFi, Sqoop, and Wavefront.
Raw Data to Insights: Data Management & Decision Making
To master data science it is important to take raw data and turn that into insights. In this course you will learn to apply and implement various essential data correction techniques, transformation rules, deductive correction techniques, and predictive modelling using critical data analytical approaches.
Tableau Desktop: Real Time Dashboards
To become a data science expert, you must master the art of data visualization. In this course you will explore how to create and use real time dashboards with Tableau
Storytelling with Data: Introduction
Explore the concept of storytelling with data, the processes involved in storytelling and interpreting data contexts. We will also explore the prominent types of analysis, visualizations, and graphic tools that we can use for storytelling.
Storytelling with Data: Tableau & PowerBI
Explore how to select the most effective visuals for storytelling, eliminating clutters, and the best practices for story design. We will also learn to work with Tableau and PowerBI to facilitate storytelling with data.
Python for Data Science: Basic Data Visualization Using Seaborn
Seaborn is a data visualization
Python for Data Science: Advanced Data Visualization Using Seaborn
Data Science Statistics: Using Python to Compute & Visualize Statistics
Discover how to use the NumPy, Pandas, and SciPy libraries to perform various statistical summary operations on real datasets and how to visualize your datasets in the context of these summaries using Matplotlib.
Advanced Visualizations & Dashboards: Visualization Using Python
Explore approaches to building and implementing visualizations, as well as plotting and graphing using Python libraries like Matplotlib, ggplot, bokeh, and Pygal.
R for Data Science: Data Visualization
Explore how to use R to create plots
and charts of data.
Advanced Visualizations & Dashboards: Visualization Using R
Discover how to build advanced charts using Python and Jupyter Notebook. Explore R and ggplot2 visualization capabilities and how to build charts and graphs with them.
Powering Recommendation Engines: Recommendation Engines
Explore how Recommendation Engines can be created and used to provide recommendations for products and content.
Data Insights, Anomalies, & Verification: Handling Anomalies
Examine statistical and machine learning implementation methods and how to manage anomalies and improvise data for better data insights and accuracy.
Data Insights, Anomalies, & Verification: Machine Learning & Visualization Tools
Discover how to use machine learning methods and visualization tools to manage anomalies and improvise data for better data insights and accuracy.
Data Science Statisitcs: Applied Inferential Statistics
Explore how different t-tests can be performed using the SciPy library to test hypotheses. How to calculate the skewness and kurtosis of data using SciPy and compute regressions using scikit-learn is also covered.
Data Science 9: Data Research Techniques
To master data science, you must learn the techniques around data research. In this course you will discover how to apply essential data research techniques, including JMP measurement, and how to valuate data using descriptive and inferential methods.
Data Science 10: Data Research Exploration Techniques
To master data science, you must learn the techniques around
- data research. In this course you will discover how to use data
- exploration techniques to derive different data dimensions and
- derive value from the data. How to practically implement data
- exploration using R, Python, linear algebra, and plots is also
- covered.
Data Scientist 14: Data Research Statistical Approaches
Discover how to apply statistical algorithms like PDF, CDF, binomial distribution, and interval estimation for data research. How to implement visualizations to graphically represent the outcomes of data research is also covered.
Machine & Deep Learning Algorithms: Introduction
Examine the fundamentals of machine learning and how Pandas ML can be used to build ML models. The workings of Support Vector Machines to perform classification of data is also covered.
Machine & Deep Learning Algorithms: Regression & Clustering
Explore the fundamentals of regression and clustering and discover how to use a confusion matrix to evaluate classification models.
Machine & Deep Learning Algorithms: Data Preperation in Pandas ML
Classification, regression, and clustering are some of the most commonly used machine learning techniques and there are various algorithms available for these tasks. Explore their application in Pandas ML.
Machine & Deep Learning Algorithms: Imbalanced Datasets Using Pandas ML
The imbalanced-learn library that integrates with Pandas ML offers several techniques to address the imbalance in datasets used for classification. Explore oversampling, undersampling, and a combination of these techniques.
Creating Data APIs Using Node.js
Explore how to create RESTful OAuth APIs using Node.js.
Data Visualization with Python
Perform data visualization tasks with Python such as creating scatter plots, plotting linear regression, using logistic regression and creating decision tree. Then, test your skills by answering assessment questions after creating time-series graphs, resampling observations, creating histograms and using a grid pair.
Final Exam: Data Scientist
Final Exam: Data Scientist will test your knowledge and application of the topics presented throughout the Data Scientist track of the Skillsoft Aspire Data Analyst to Data Scientist Journey.
Course options
We offer several optional training products to enhance your learning experience. If you are planning to use our training course in preperation for an official exam then whe highly recommend using these optional training products to ensure an optimal learning experience. Sometimes there is only a practice exam or/and practice lab available.
Optional practice exam (trial exam)
To supplement this training course you may add a special practice exam. This practice exam comprises a number of trial exams which are very similar to the real exam, both in terms of form and content. This is the ultimate way to test whether you are ready for the exam.
Optional practice lab
To supplement this training course you may add a special practice lab. You perform the tasks on real hardware and/or software applicable to your Lab. The labs are fully hosted in our cloud. The only thing you need to use our practice labs is a web browser. In the LiveLab environment you will find exercises which you can start immediately. The lab enviromentconsist of complete networks containing for example, clients, servers,etc. This is the ultimate way to gain extensive hands-on experience.
Sign In
WHY_ICTTRAININGEN
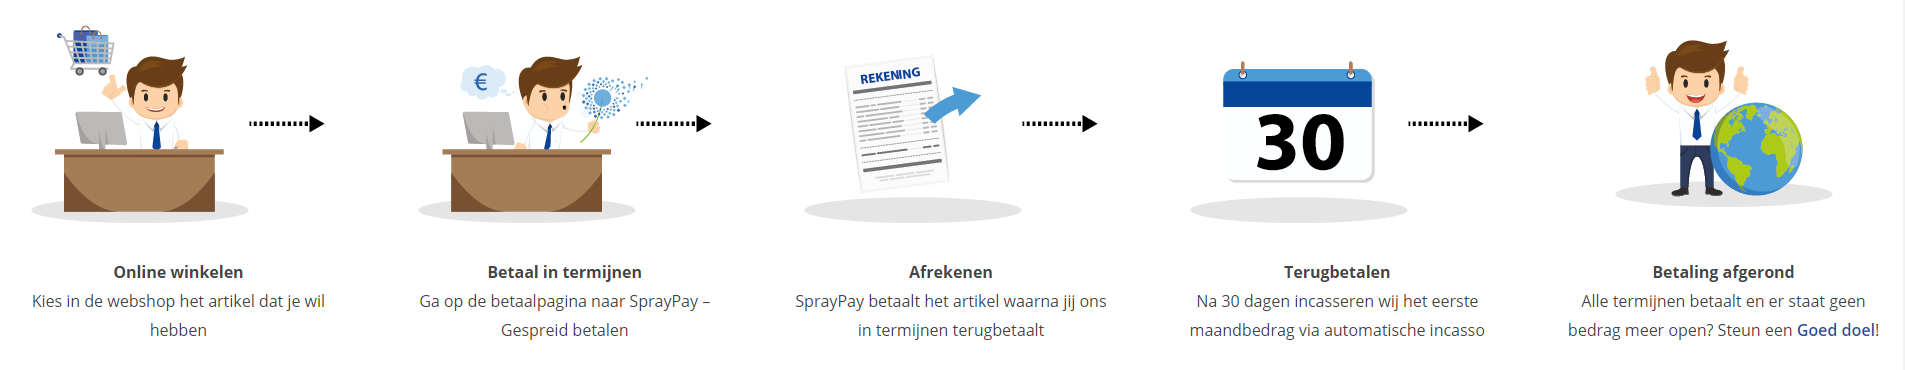
Betaal in termijnen
| Cursusnaam | |
| Looptijd | |
| Rentebedrag financiering | |
| Totaal bedrag | |
| Maandbedrag |

Gespreid betalen met Spraypay
Met de betaaloptie SprayPay kun je jouw bestelling van € 250,- tot € 3.500,- veilig en gespreid betalen in gelijke termijnen van 12, 18, 24 of 36 maanden. Je hebt op die manier een minimale financiële belasting en je kunt eenvoudig de termijnbetalingen opnemen in jouw vaste lasten.
Hoe werkt het kopen op afbetaling? De beoordeling van de kredietaanvraag vindt online plaats. Binnen enkele seconden weet je of je in aanmerking komt voor een krediet. Is de aanvraag akkoord dan kun je meteen genieten van je aankoop.
Let op: deze betaalmetode is aleen beschikbaar voor particulieren! Bekijk voor je aankoop ook de SprayPay voorwaarden.
Via ons opleidingsconcept bespaar je tot 80% op trainingen
Start met leren wanneer je wilt. Je bepaalt zelf het gewenste tempo
Spar met medecursisten en profileer je als autoriteit in je vakgebied.
Ontvang na succesvolle afronding van je cursus het officiële certificaat van deelname van Icttrainingen.nl
Krijg inzicht in uitgebreide voortgangsinformatie van jezelf of je medewerkers
Kennis opdoen met interactieve e-learning en uitgebreide praktijkopdrachten door gecertificeerde docenten
Orderproces
Once we have processed your order and payment, we will give you access to your courses. If you still have any questions about our ordering process, please refer to the button below.
read more about the order process
Een zakelijk account aanmaken
Wanneer u besteld namens uw bedrijf doet u er goed aan om aan zakelijk account bij ons aan te maken. Tijdens het registratieproces kunt u hiervoor kiezen. U heeft vervolgens de mogelijkheden om de bedrijfsgegevens in te voeren, een referentie en een afwijkend factuuradres toe te voegen.
Betaalmogelijkheden
U heeft bij ons diverse betaalmogelijkheden. Bij alle betaalopties ontvangt u sowieso een factuur na de bestelling. Gaat uw werkgever betalen, dan kiest u voor betaling per factuur.

Cursisten aanmaken
Als u een zakelijk account heeft aangemaakt dan heeft u de optie om cursisten/medewerkers aan te maken onder uw account. Als u dus meerdere trainingen koopt, kunt u cursisten aanmaken en deze vervolgens uitdelen aan uw collega’s. De cursisten krijgen een e-mail met inloggegevens wanneer zij worden aangemaakt en wanneer zij een training hebben gekregen.
Voortgangsinformatie
Met een zakelijk account bent u automatisch beheerder van uw organisatie en kunt u naast cursisten ook managers aanmaken. Beheerders en managers kunnen tevens voortgang inzien van alle cursisten binnen uw organisatie.
What is included?
| Certificate of participation | Yes |
| Monitor Progress | Yes |
| Award Winning E-learning | Yes |
| Mobile ready | Yes |
| Sharing knowledge | Unlimited access to our IT professionals community |
| Study advice | Our consultants are here for you to advice about your study career and options |
| Study materials | Certified teachers with in depth knowledge about the subject. |
| Service | World's best service |
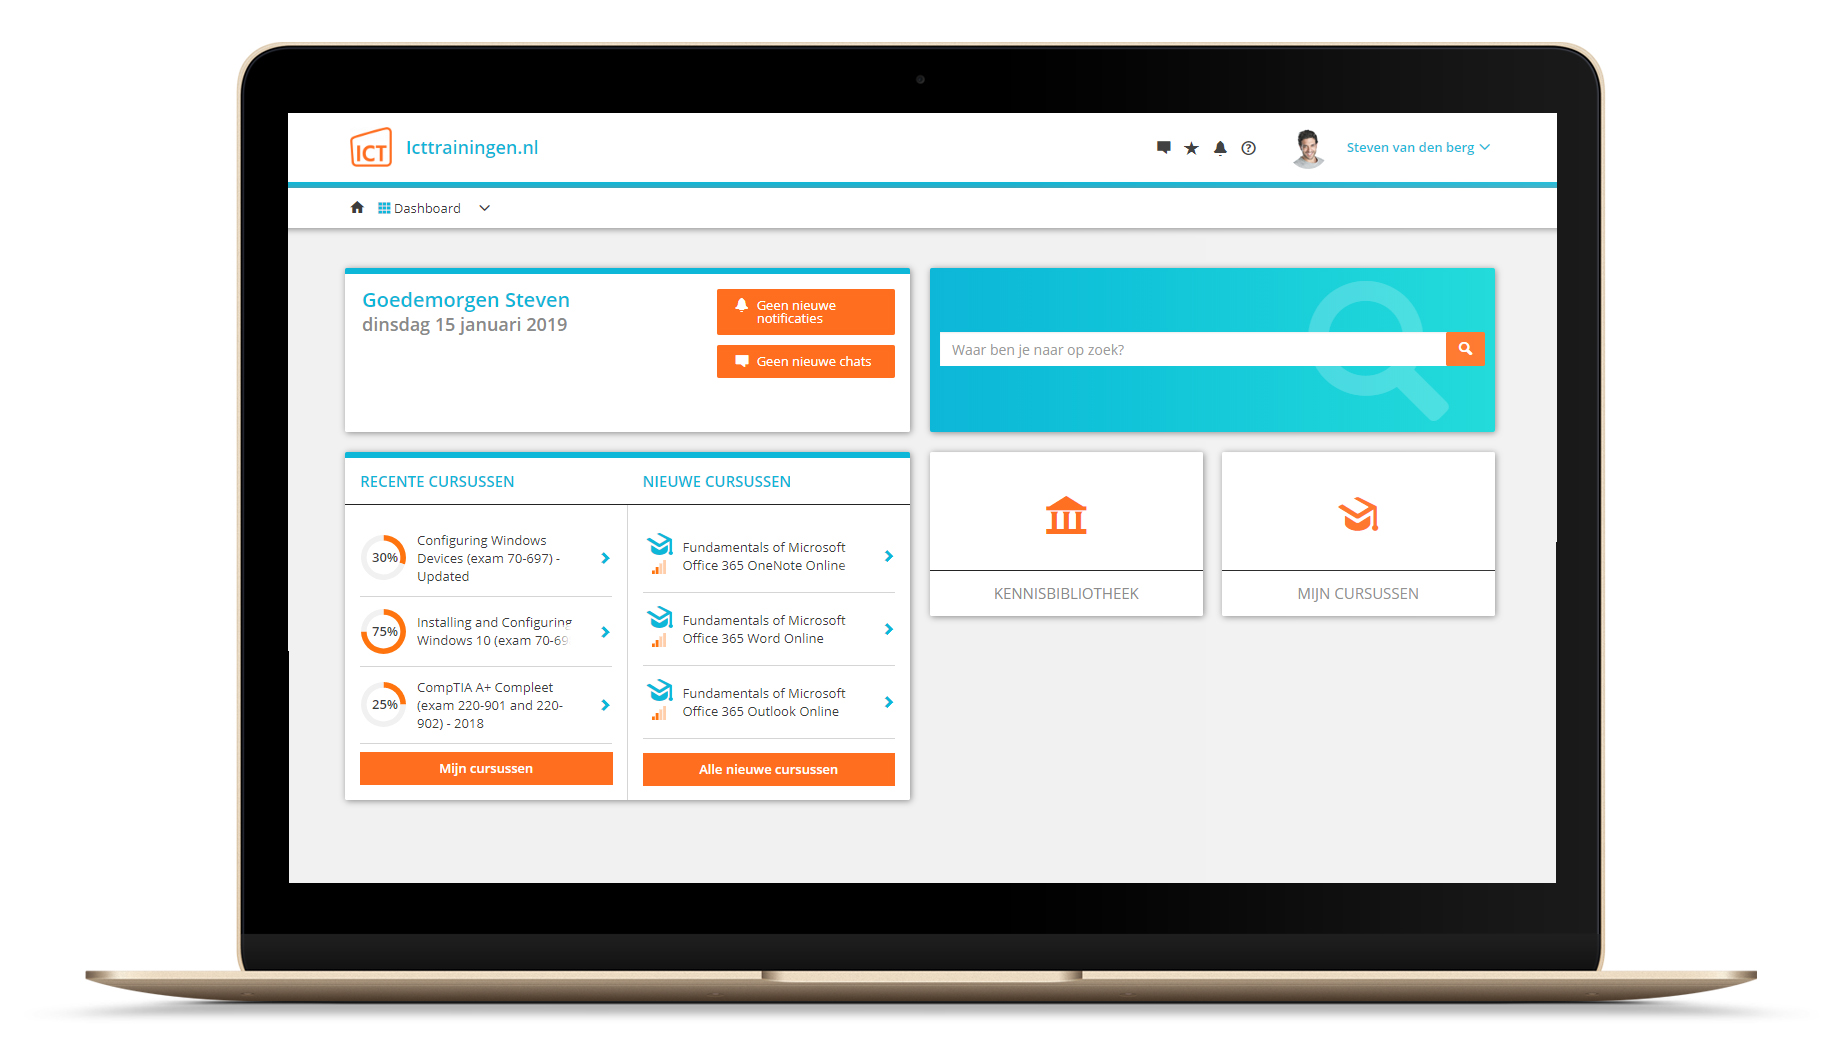
Platform
Na bestelling van je training krijg je toegang tot ons innovatieve leerplatform. Hier vind je al je gekochte (of gevolgde) trainingen, kan je eventueel cursisten aanmaken en krijg je toegang tot uitgebreide voortgangsinformatie.
FAQ
Niet gevonden wat je zocht? Bekijk alle vragen of neem contact op.