Course: Statistical Analysis and Modelling in R
duration: 15 hours |
Language: English (US) |
access duration: 90 days |

Details
Statistics is getting more and more important in different business fields. Interpreting data is a core pre-processing step in data analysis and modeling. Use this course to practice using various dynamic statistical tools to explore and understand your data. You'll explore population distributions to model random variables, work with discrete and continuous probability distributions, and use discrete probability distribution types, such as the uniform, binomial, and Poisson distributions. Next, you will learn how to set up the null and alternative hypotheses for your tests and interpret the results. Examine the most commonly used statistical tests, the T-test and the analysis of variance (ANOVA).
Regression models are used to predict continuous values and are some of the most commonly used machine learning models. Use this course to grasp what exactly machine learning (ML) algorithms are and how you can use ML models to predict outcomes based on input data. You'll learn to use logistic regression and decision trees to build classification models and evaluate your models using accuracy, precision, and recall. Clustering is an unsupervised learning algorithm that self-discovers patterns in data and helps identify logical groupings. You’ll learn to distinguish between supervised and unsupervised learning and recognize how regression and classification algorithms differ from clustering. Finally, you’ll learn to understand bias-variance trade-off that allows data scientist to build generalizable models that perform well on test data.
Result
After following this course, you will be able to use various dynamic statistical tools to explore and understand your data.
Prerequisites
No formal prerequisites. However, some experience with statistical analysis is recommended.
Target audience
Data analist
Content
Statistical Analysis and Modelling in R
Statistical Analysis and Modeling in R: Working with Probability Distributions
- Interpreting data is a core pre-processing step in data analysis and modeling. Use this course to practice using various dynamic statistical tools to explore and understand your data.
- During this course, you'll explore population distributions to model random variables, work with discrete and continuous probability distributions, and use discrete probability distribution types, such as the uniform, binomial, and Poisson distributions.
- You'll also examine continuous distributions, such as the normal and the exponential distributions.
- You'll round the course off by learning how to read and interpret QQ plots, which can be used to compare the distributions of two samples of data.
- When you're finished, you'll be able to use probability distributions to model events and understand your data.
Statistical Analysis and Modeling in R: Understanding & Interpreting Statistical Tests
- Statistical analysis involves making educated guesses known as hypotheses and testing them to see if they hold up. Use this course to learn how to apply hypothesis testing to your data.
- Examine the use of descriptive statistics to summarize data and inferential statistics to draw conclusions. Learn how population parameters differ from summary statistics and how confidence intervals are used.
- Discover how to perform hypothesis testing on sample data, construct null and alternative hypotheses, and interpret the results of your statistical tests.
- Investigate the significance of the p-value of a statistical test and how it can be interpreted using the significance threshold or alpha level.
- Additionally, examine the most commonly used statistical tests, the T-test and the analysis of variance (ANOVA).
- When you're done, you'll have the confidence to set up the null and alternative hypotheses for your tests and interpret the results.
Statistical Analysis and Modeling in R: Statistical Analysis on Your Data
- Hypothesis testing determines whether the educated guesses you've made about your data should be accepted or rejected. T-tests and ANOVA tests are some of the most commonly used methods in hypothesis testing. Knowing how to perform and interpret these tests are core data scientist skills.
- In this course, get hands-on running statistical tests on your sample data. Test assumptions made by statistical tests, run T-tests, perform ANOVA analysis, and interpret the results.
- Perform the one-sample t-test and the one-sample Z-test. Run the two-sample t-test to compare data from different groups or categories and the paired samples t-test to compare data across time.
- When you're finished with this course, you'll have the know-how to run and interpret statistical tests using the R programming language.
Statistical Analysis and Modeling in R: Performing Regression Analysis
- Regression models are used to predict continuous values and are some of the most commonly used machine learning models.
- Use this course to grasp what exactly machine learning (ML) algorithms are and how you can use ML models to predict outcomes based on input data.
- Learn how regression models work, train them, and evaluate regression results using metrics such as R2 and RMSE. Perform regression analysis in R using the ordinary least squares regression. Build models using simple and multiple regression and train a regression model using cross-validation.
- Upon completing this course, you'll be able to perform regression to predict continuous values and evaluate these models using metrics such as the R2 and adjusted R2.
Statistical Analysis and Modeling in R: Performing Classification
- Classification models are used to classify or categorize data points into two or more categories. Learn how these models work and how you can evaluate your classification models using the confusion matrix and metrics such as accuracy, precision, and recall.
- During this course, you'll perform classification using both logistic regression and an imbalanced dataset. You'll also examine why precision or recall scores may be better metrics than accuracy to evaluate such models.
- Furthermore, build a classification model using decision trees, visualize the tree structure, and explore the variable importance assigned by this tree structure to understand and interpret the model.
- When you've finished this course, you'll be able to confidently use logistic regression and decision trees to build classification models and evaluate your models using accuracy, precision, and recall.
Statistical Analysis and Modeling in R: Performing Clustering
- Clustering is an unsupervised learning algorithm that self-discovers patterns in data and helps identify logical groupings. Use this course to distinguish between supervised and unsupervised learning and recognize how regression and classification algorithms differ from clustering.
- Examine the basic principles of clustering models and how k-means clustering finds logical groupings in your data. Learn the evaluation techniques used in clustering and find the optimal number of clusters in your data using both the elbow method and the Silhouette score.
- Perform clustering on a dataset with multiple attributes and visualize clusters in your data using principal components.
- When you've completed this course, you'll be able to find groupings in your data using k-means clustering and compute the optimal number of clusters for your data.
Statistical Analysis and Modeling in R: Building Regularized Models & Ensemble Models
- Understanding the bias-variance trade-off allows data scientists to build generalizable models that perform well on test data. Machine learning models are considered a good fit if they can extract general patterns or dominant trends in the training data and use these to make predictions on unseen instances.
- Use this course to discover what it means for your model to be a good fit for the training data. Identify underfit and overfit models and what the bias-variance trade-off represents in machine learning.
- Mitigate overfitting on training data using regularized regression models, train and evaluate models built using ridge regression, lasso regression, and ElasticNet regression, and implement ensemble learning using the random forest model.
- When you're done with this course, you'll have the skills and knowledge to train models that learn general patterns using regularized models and ensemble learning.
Course options
We offer several optional training products to enhance your learning experience. If you are planning to use our training course in preperation for an official exam then whe highly recommend using these optional training products to ensure an optimal learning experience. Sometimes there is only a practice exam or/and practice lab available.
Optional practice exam (trial exam)
To supplement this training course you may add a special practice exam. This practice exam comprises a number of trial exams which are very similar to the real exam, both in terms of form and content. This is the ultimate way to test whether you are ready for the exam.
Optional practice lab
To supplement this training course you may add a special practice lab. You perform the tasks on real hardware and/or software applicable to your Lab. The labs are fully hosted in our cloud. The only thing you need to use our practice labs is a web browser. In the LiveLab environment you will find exercises which you can start immediately. The lab enviromentconsist of complete networks containing for example, clients, servers,etc. This is the ultimate way to gain extensive hands-on experience.
Sign In
WHY_ICTTRAININGEN
Betaal in termijnen
| Cursusnaam | |
| Looptijd | |
| Rentebedrag financiering | |
| Totaal bedrag | |
| Maandbedrag |

Gespreid betalen met Spraypay
Met de betaaloptie SprayPay kun je jouw bestelling van € 250,- tot € 3.500,- veilig en gespreid betalen in gelijke termijnen van 12, 18, 24 of 36 maanden. Je hebt op die manier een minimale financiële belasting en je kunt eenvoudig de termijnbetalingen opnemen in jouw vaste lasten.
Hoe werkt het kopen op afbetaling? De beoordeling van de kredietaanvraag vindt online plaats. Binnen enkele seconden weet je of je in aanmerking komt voor een krediet. Is de aanvraag akkoord dan kun je meteen genieten van je aankoop.
Let op: deze betaalmetode is aleen beschikbaar voor particulieren! Bekijk voor je aankoop ook de SprayPay voorwaarden.

Via ons opleidingsconcept bespaar je tot 80% op trainingen
Start met leren wanneer je wilt. Je bepaalt zelf het gewenste tempo
Spar met medecursisten en profileer je als autoriteit in je vakgebied.
Ontvang na succesvolle afronding van je cursus het officiële certificaat van deelname van Icttrainingen.nl
Krijg inzicht in uitgebreide voortgangsinformatie van jezelf of je medewerkers
Kennis opdoen met interactieve e-learning en uitgebreide praktijkopdrachten door gecertificeerde docenten
Orderproces
Once we have processed your order and payment, we will give you access to your courses. If you still have any questions about our ordering process, please refer to the button below.
read more about the order process
Een zakelijk account aanmaken
Wanneer u besteld namens uw bedrijf doet u er goed aan om aan zakelijk account bij ons aan te maken. Tijdens het registratieproces kunt u hiervoor kiezen. U heeft vervolgens de mogelijkheden om de bedrijfsgegevens in te voeren, een referentie en een afwijkend factuuradres toe te voegen.
Betaalmogelijkheden
U heeft bij ons diverse betaalmogelijkheden. Bij alle betaalopties ontvangt u sowieso een factuur na de bestelling. Gaat uw werkgever betalen, dan kiest u voor betaling per factuur.

Cursisten aanmaken
Als u een zakelijk account heeft aangemaakt dan heeft u de optie om cursisten/medewerkers aan te maken onder uw account. Als u dus meerdere trainingen koopt, kunt u cursisten aanmaken en deze vervolgens uitdelen aan uw collega’s. De cursisten krijgen een e-mail met inloggegevens wanneer zij worden aangemaakt en wanneer zij een training hebben gekregen.
Voortgangsinformatie
Met een zakelijk account bent u automatisch beheerder van uw organisatie en kunt u naast cursisten ook managers aanmaken. Beheerders en managers kunnen tevens voortgang inzien van alle cursisten binnen uw organisatie.
What is included?
| Certificate of participation | Yes |
| Monitor Progress | Yes |
| Award Winning E-learning | Yes |
| Mobile ready | Yes |
| Sharing knowledge | Unlimited access to our IT professionals community |
| Study advice | Our consultants are here for you to advice about your study career and options |
| Study materials | Certified teachers with in depth knowledge about the subject. |
| Service | World's best service |
Platform
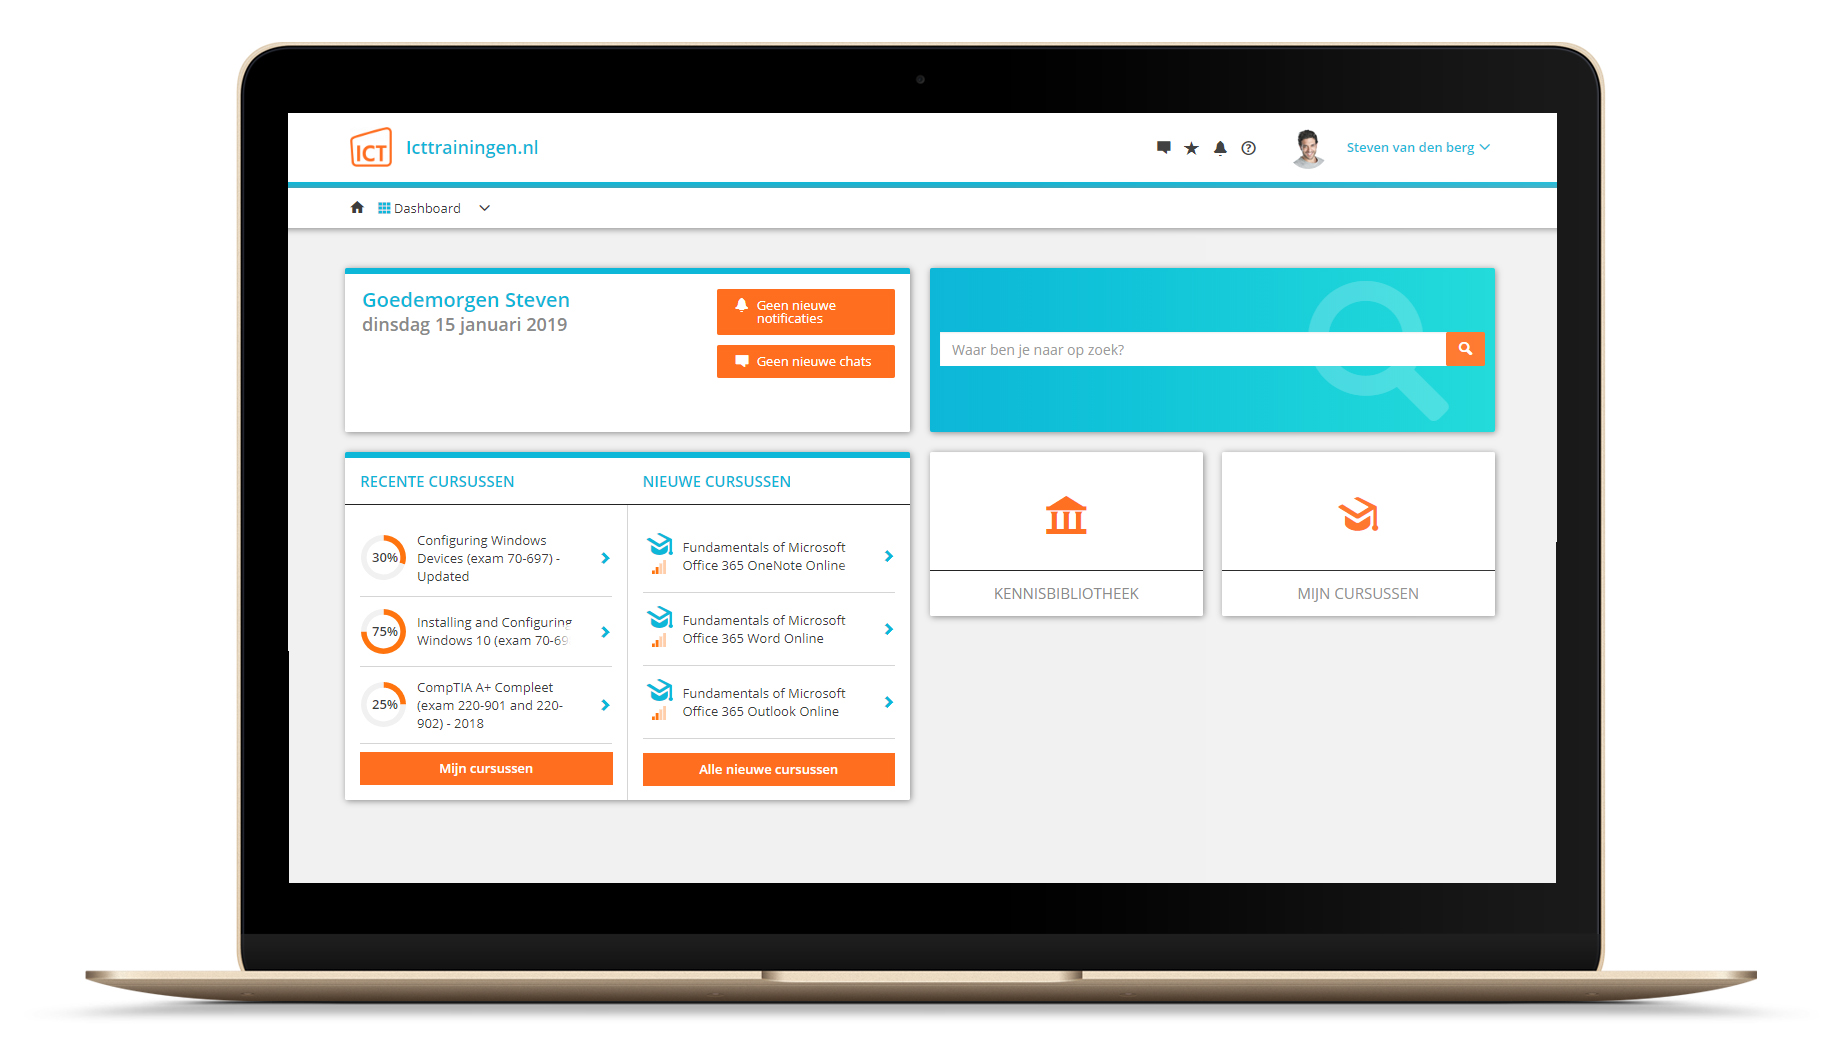
Na bestelling van je training krijg je toegang tot ons innovatieve leerplatform. Hier vind je al je gekochte (of gevolgde) trainingen, kan je eventueel cursisten aanmaken en krijg je toegang tot uitgebreide voortgangsinformatie.
FAQ
Niet gevonden wat je zocht? Bekijk alle vragen of neem contact op.